Bluebird conservation by the community…it’s for the birds.
Home
About Us
About Us
Privacy Policy
Terms of Use
Cookie Policy
News
Gallery
Photo Gallery
Video Gallery
Nest Box Plans
Links and Resources
Get Involved
Forms and Information
Contact Us
Select Page
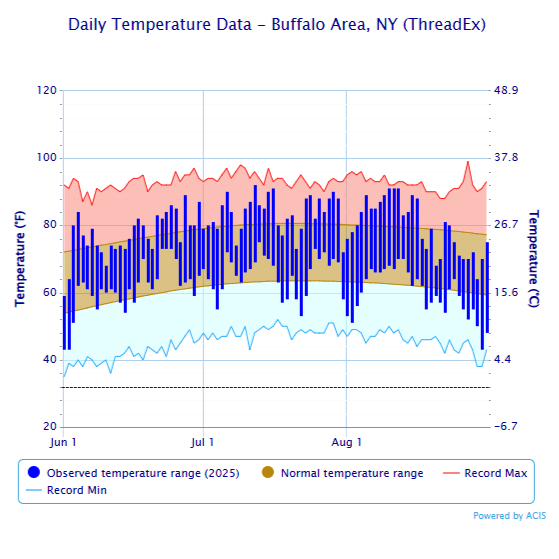
Daily Temperature Data – Buffalo Area NY Summer
by
A. T. Baron
|
Sep 5, 2025
Recent Posts
2026 Year-End Results
2026 NYSBS Annual Conference
2025 Year-End Results
Weather or Not to Check the Nest Box
2025 NYSBS Annual Conference
Archives
Archives
Select Month
October 2026
March 2026
September 2025
April 2025
March 2025
September 2024
August 2024
March 2024
October 2023
June 2023
October 2022
August 2022
June 2022
March 2022
September 2021
June 2020
October 2019
March 2019
January 2019
October 2018
May 2018
March 2018
September 2017
July 2017
April 2017
March 2017
November 2016
July 2016
April 2016
February 2016
September 2015
August 2015
July 2015
June 2015
May 2015
April 2015
October 2014
August 2014
July 2014
June 2014
May 2014
March 2014
February 2014
January 2014
September 2013
August 2013
July 2013
June 2013
May 2013
Categories
Categories
Select Category
Education
NestWatch Data
Uncategorized
Updates
Subscribe